“Orion Visual Analytics allows firm management to easily spot problem areas such as non-productive attorneys or clients who are slow to pay. This vital insight into our Orion financial data helps us see what can be improved upon, which is essential for timely and efficient management of the firm. This interactive and visual business intelligence platform is an excellent tool that I would recommend to any law firm."
Managing Partner
Mid-sized Law Firm
⸺⸺ Orion Visual Analytics PDF Resource ⸺⸺
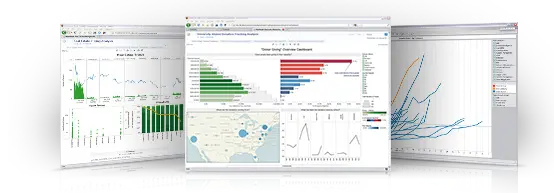
Orion Visual Analytics provides easy to understand, concise insight into your law firm’s most important business questions. This platform enables you to gain insight from your Orion data more efficiently than you ever have before by replacing traditional management reports and Excel spreadsheets with a powerful and interactive visual analysis tool. Orion Visual Analytics provides legal professionals with quick access to financial performance information at a variety of levels.
With Orion Visual Analytics, you can easily identify trends, make comparisons and focus on exceptions that may be affecting your firm’s overall performance. Gone are the days of exporting data to spreadsheets to perform calculations while struggling to display the reformatted information. Orion Visual Analytics completes this work for you in one easy step - which will save your firm valuable time, improves your firm’s analytical capabilities and strengthens the overall strategic planning process. This newfound knowledge will enhance Financial Management, Business Development, Resource Allocation, Technology Investment, Employee Compensation, Personnel Recruitment, Employee Training, Organization & Workflow, Communication Processes and Client Relationships.
Smarter and Easier Decision Making
Orion Visual Analytics can access all of your Orion data to help you answer key questions and make critical business decisions such as:
- Which types of Clients owe us the most money for the longest period of time and to what degree is this affecting our firm’s bottom line?
- In which types of law or practice areas are we experiencing the largest write-downs and what’s causing it?
- What has been the trend over the last 5 years in our billing rates, realization rates, write-downs and why?
- What is our current total dollar exposure from potential e-billing?
The insights gained from the ability to drill down into your data through Orion Visual Analytics’ dynamic visualizations will have a positive impact on your firm’s strategic planning in all aspects of your practice. Orion’s Visual Analytics saves you valuable time, improving your firms’ analytical capabilities and strengthens the overall strategic planning process at your firm.
Orion Visual Analytics can uncover the data trends you are searching to find while uncovering the “why’s” hidden in your data, therefor enabling the ability to make the most well-informed business decisions possible.

Visualize
- Your Orion financial data is instantly converted from numbers into the correct visual presentation.
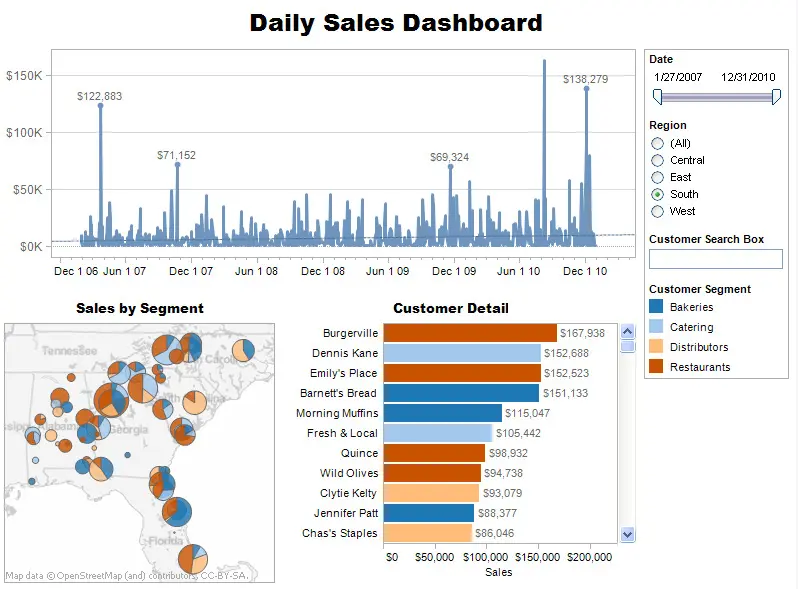
- Orion Visual Analytics automatically selects the type of visual display that will best present your data (e.g. bar chart, trend line, scatter plot, etc.).
- Easily identify important trends, make comparisons and highlight exceptions in your data.
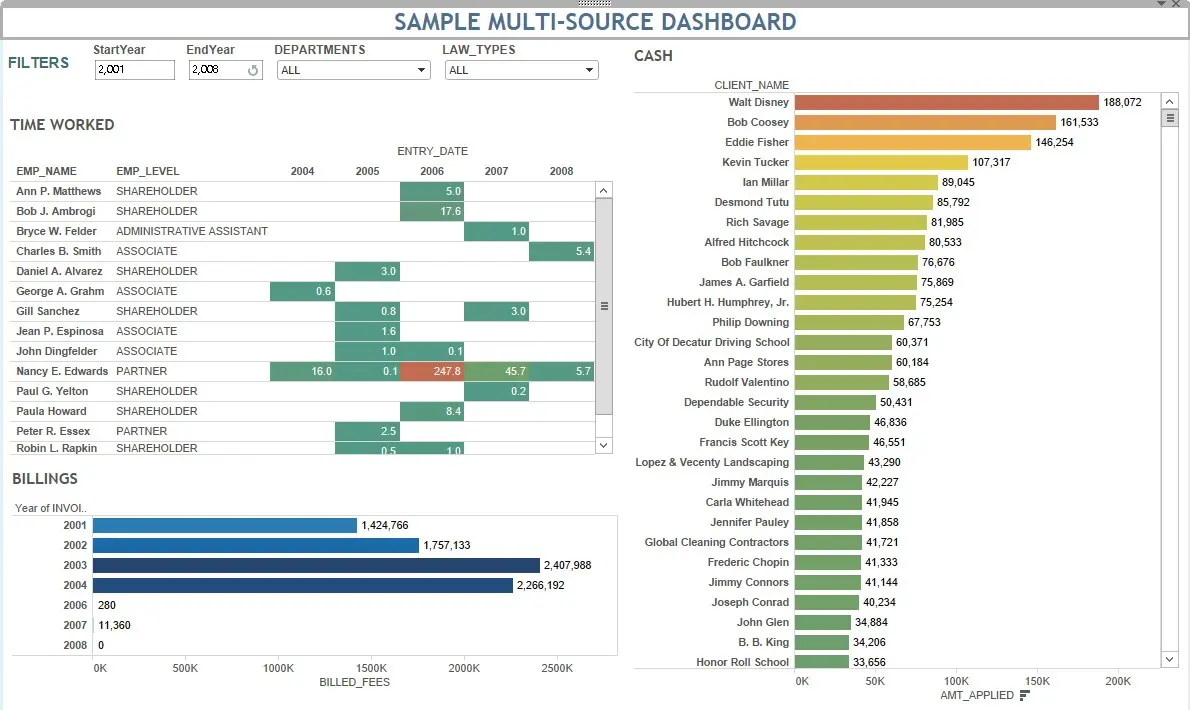
- Complete customization, dashboard creation based on the needs of your firm.


Share
- All pre-configured dashboards, plus those created by your firm, can be shared with others using your firm’s existing file-sharing procedure.
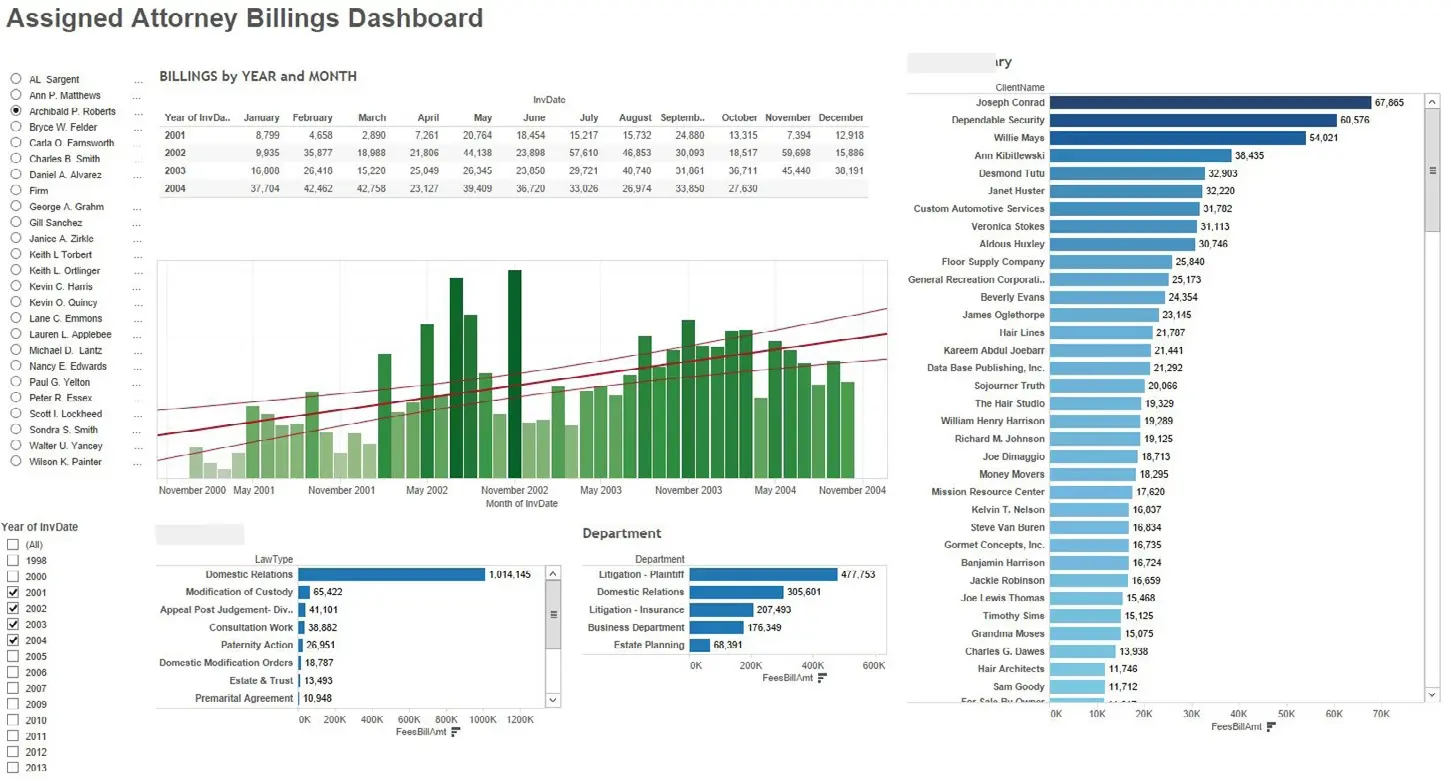
- Helpful pre-configured dashboards include Firm Overview, Accounts Receivable, Work in Process, New Business Development, Financial Analysis, Billing Attorney, Timekeeper, Attorney Statistics and WIP Edit Analysis.
- No more waiting for your Accounting department to run reports for you, use Orion Visual Analytics in real-time during your meetings.

